‘The culmination of the Bull market in September 1929 was really the result of a long term business cycle which began in August 1896 and continued for 33 years, with each campaign in the market making higher prices, which showed that the long term trend was up.’
W.D. Gann, the New York Trend Detector
In his Stock Market Course, Gann had a section called the Dow Jones Resistance Levels where he particularly focused on the Sharp V bottom of Aug 8 1896 low 42 up until the Final top of Sept 3 1929
1896-1929 = 33years
The exact distance between the dates was 33.07 years, 396.81 months, 1725 weeks and 12078 days.
Below is a chart cast for the 8th August 1896
Look within the circle and you’ll see lots of squares and oppositions between planets forming a Fixed Square/cross.
This is a square within a circle – one of the shapes in Gann’s Emblem. When planets form such alignments, the energy is very difficult. Especially the fixed quality which adds more constriction to the natural flow of energy. The four fixed signs are Taurus, Leo, Scorpio and Aquarius referred to as the four beasts in the Bible. As a midday chart, you can see the dominance of Fixed in the grid below. Fire is also the dominant element which brings in the theme of heat and destruction.

FINAL TOP SEPTEMBER 3RD 1929
In comparison, the planetary energy leading into the high in 1929, there were more sextiles and trines with an overall balance in terms of qualities and elements. These simple techniques are often overlooked in chart analysis however can help determine the energy level of the day. They are called chart signature patterns.

FINAL LOW JULY 8 1932 AT 40.5
Gann then mentions the End of the Great Bear Market.
1896-1932 = 36 years
1932 takes us to Tunnel Thru the Air specifically from page 300.
Edna says, “Mr Gordon, do you know that the market is following the forecast you mapped out in 1927?”….Edna asked if he thought that there was any hope of the terrible war was ending soon. “No,” he replied, “it will get worse in 1931 when many nations will join against us. The end will not come until the summer or fall of 1932.”
What is fascinating about this low was that it was one day before the exact trine of Jupiter and Uranus; the day the upward trend began both in fire signs.

LOW AFTER CRASH 1987
Looking forward now, some 55 years to the day of the low after the 1987 crash, what can we see that is similar to the 1932 low.
Jupiter is once again Trine Uranus and this time also to Saturn. Again we have the exact same degree of a fire sign.
23 degrees of the Fire sign is a very sensitive degree in these charts.
At the High in 1929, Saturn was 23 Sagittarius, then at the low transiting Jupiter at 23 Leo Trine transiting Uranus at 23 Aries, formed a grand Trine with the natal Saturn in 1929.
In 1987, we find these three planets again at these sensitive degrees in a FIRE sign.

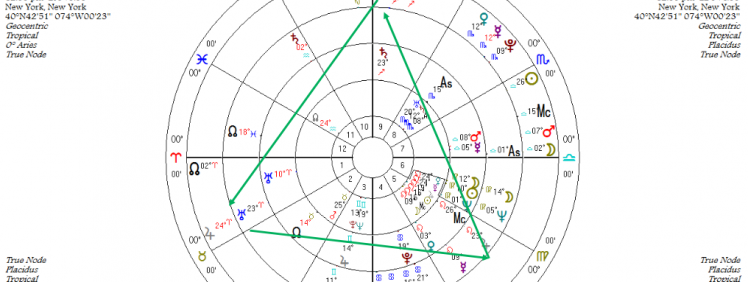
Below are the 4 charts overlapped in a quad-wheel, I know is can look a little confusing at first however just observe the Grand Trine (green triangle) and the planets at 23-24 degrees in the Fire signs of Aries, Leo and Sagittarius at the three points.

I will finish this article with a quote from Luther Jensen pg 36 Astro-Cycles and Speculative Markets.
“Since 1896 Uranus and Jupiter have been in a favourable aspect 28 times. In every case these aspects coincided with gains in business activity. The July 8th depression low coincided with the exact trine of these two planets on the 9th July 1932- the day the upward thrust began. A synthesis of the relationship by aspect and sign position of Jupiter, Saturn and Uranus, plus the sunspot cycle if the frame work upon which to project the primary trends of business and the markets.”